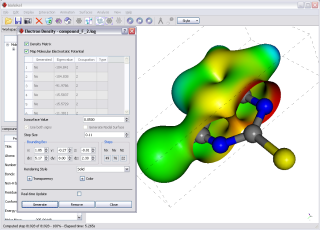
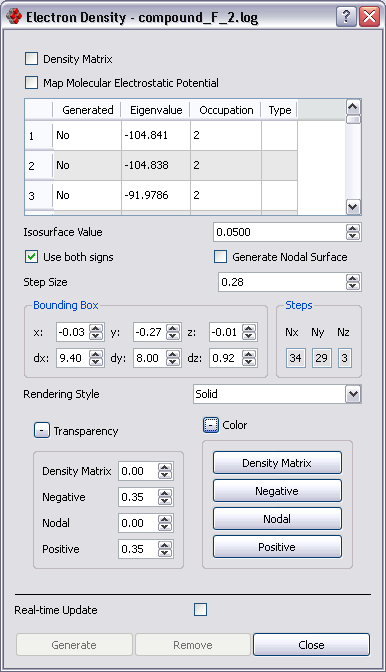
Use the Electron Density Surface dialog (Surfaces-Electron Density) to generate surfaces from electron density data.
UI controls are enabled only when data is available for the selected molecule.
Regenerating a surface previously created simply replaces the previously generated surface.
The rendering style can be changed after the surface is generated.
Checking the "Real-time Update" check-box will cause a surface to be re-generated without having to press the Generate button each time any value in the dialog box changes.
The following settings are persistent across sessions (i.e. will be stored on disk and retrieved when Molekel starts):
- Isosurface value
- Use both signs
- Generate Nodal Surface
- Sep Size
- Transparency
- Color
Use the bounding box size and center to select the volume of interest.
Hint - Use low-resolution (i.e. large step size) and check the real-time update box while adjusting the bounding box: the surface will be quickly recomputed at each change of the bounding box parameters; you can then decrease the step size as needed.
Note: there is an excellent article on how to visualize electron density data from Gaussian 09 files here: http://baoilleach.blogspot.com/2010/06/visualising-orbitals-and-density-with.html
Videos
A video showing how to generate electron density surface with color coded Electrostatic Potential values is here: http://molekel.cscs.ch/video/eldens_big.htm ... ...and another one showing the use of real-time update to adjust the bounding box is here: http://molekel.cscs.ch/video/eldens_rt_update_big.htm
Another video available here: http://molekel.cscs.ch/video/orbitals_big.htm shows how to generate orbitals.
Add density matrix surface
- Check Density Matrix checkbox
- Adjust bounding box and step
- Select rendering style
- Press the Generate button
Remove Density Matrix surface
- Check Density Matrix checkbox
- Press the Remove button
Add orbital surface
- Click on the row corresponding to the orbital surface to generate (click on any column except the one with orbital numbers).
- Adjust bounding box and step
- Select rendering style
- Press the Generate button
Remove orbital surface
- Click on the row corresponding to the orbital surface to generate
- Press the Remove button
Gaussian 03
In order to visualize molecular orbitals from Gaussian 03 output files the * ATOMIC CENTER * ATOMIC ORBITAL * GAUSSIAN FUNCTIONS * table must be present in the file.
To have the basis functions printed in the correct format for Molekel use gfoldprint and pop=full when running Gaussian 03.
Also do not include the word basis in the title line of your Gaussian input file.
note: If you just want to visualize IR spectra (Freq=HPmodes) you don't need gfoldprint