Molekel can display infra-red and Raman activity spectra if the information is available in the loaded file.
To display the radiation spectrum dialog:
- select the molecule
- select the Analysis->Radiation Spectrum menu item
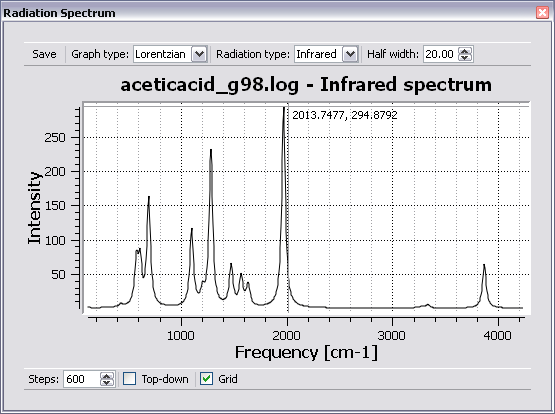
The radiation spectrum window allows the user to select the diagram type (infra-red or Raman) and display style as well as to save the graph to PostScript or PDF formats.
Moving the mouse pointer over the graph displays frequency and intensity information at the pointer position.
A video showing radiation spectra in action is available here: http://molekel.cscs.ch/video/radiation_spectrum_big.htm